Floor area ratio vs. lot coverage: what signals underbuilt land
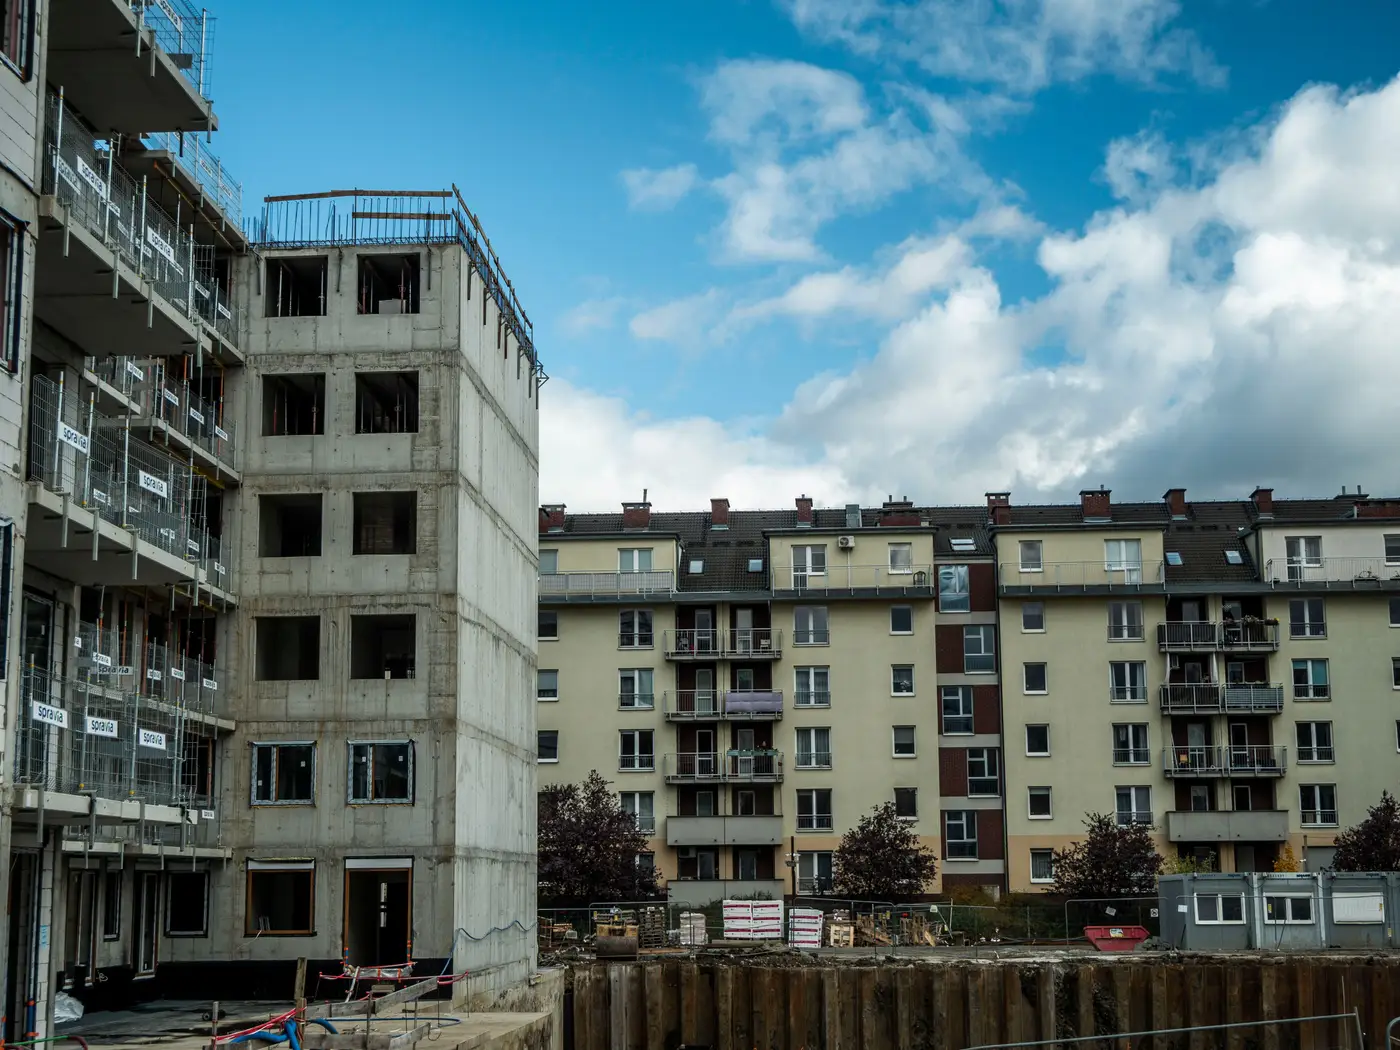
Every zoning code has both numbers sitting right next to each other: floor area ratio and lot coverage. Pull up the municipal code for almost any submarket and you'll see something like "FAR 2.0, max lot coverage 60%" in the same table. Analysts scanning parcels for acquisition targets sometimes treat these as two ways of saying the same thing. They're not, and the gap between them is where the underbuilt sites hide.
What FAR calculation measures
Floor area ratio is gross floor area divided by site area. A 10,000 sq ft lot zoned FAR 3.0 can legally hold 30,000 sq ft of building, stacked across as many floors as height limits and the building code allow. FAR doesn't care how much ground the building touches. A single-story 10,000 sq ft warehouse on that lot uses an FAR of 1.0. A six-story building covering half the lot at 5,000 sq ft per floor also gets you to FAR 3.0, the maximum allowed.
The ratio caps total buildable square footage, no matter how small or large the footprint is. Running FAR calculations off assessor data really asks one question: how much of the allowed envelope is a parcel using right now?
What lot coverage ratio measures
Lot coverage is footprint over site area. How much of the ground plane the building occupies, full stop. It ignores height and floor count entirely. A code that caps coverage at 60% is really protecting open space, setbacks, and stormwater capacity, not controlling density.
Here's why the two diverge in practice. A parcel can be at or near its lot coverage limit, building footprint filling most of the buildable area, while sitting far under its FAR cap, because the structure is only one or two stories in a zone that allows five or six. That's a single-story retail box, a surface parking structure, a low-rise strip center on land entitled for mid-rise. The ground is full. The air above it is empty.
Where the two numbers disagree, that's your underbuilt signal
The screening logic comes down to this: low FAR utilization paired with high lot coverage is the pattern worth flagging. It means a site has already used up most of its footprint allowance but left most of its vertical entitlement on the table. That's a stronger underbuilt signal than low FAR alone, because low FAR with low coverage might just be a parking lot or a vacant pad, which you'd catch anyway by other means.
A few things produce this pattern on the ground: a single-tenant retail building from the 1970s that predates a later upzoning, a self-storage facility sitting on land now zoned for mixed-use, a surface parking lot attached to a low-rise office building in a corridor that got rezoned for height. None of these show up as "vacant" in a records search. They show up as built, occupied, generating some income, and sitting well under what the zoning envelope allows.
Why assessor records only get you partway
The problem with running this screen from zoning tables and assessor rolls alone is that both of those lag. Parcels get rezoned, variances get granted, and records don't always catch up to what's standing on the ground, or to additions and demolitions that haven't been permitted or recorded yet. A FAR gap calculated from stale square-footage data might not reflect the current building at all.
That's the gap Development Capacity is built to close: it works from current imagery and change history across a submarket to flag parcels where the built footprint and apparent building bulk look low relative to what's around them, and hands back a ranked parcel list instead of a records query you have to run block by block.
If you're screening a submarket for FAR-gap sites right now, that's worth a look before you start pulling parcels one at a time.