Spotting assemblage opportunities in adjacent underused parcels
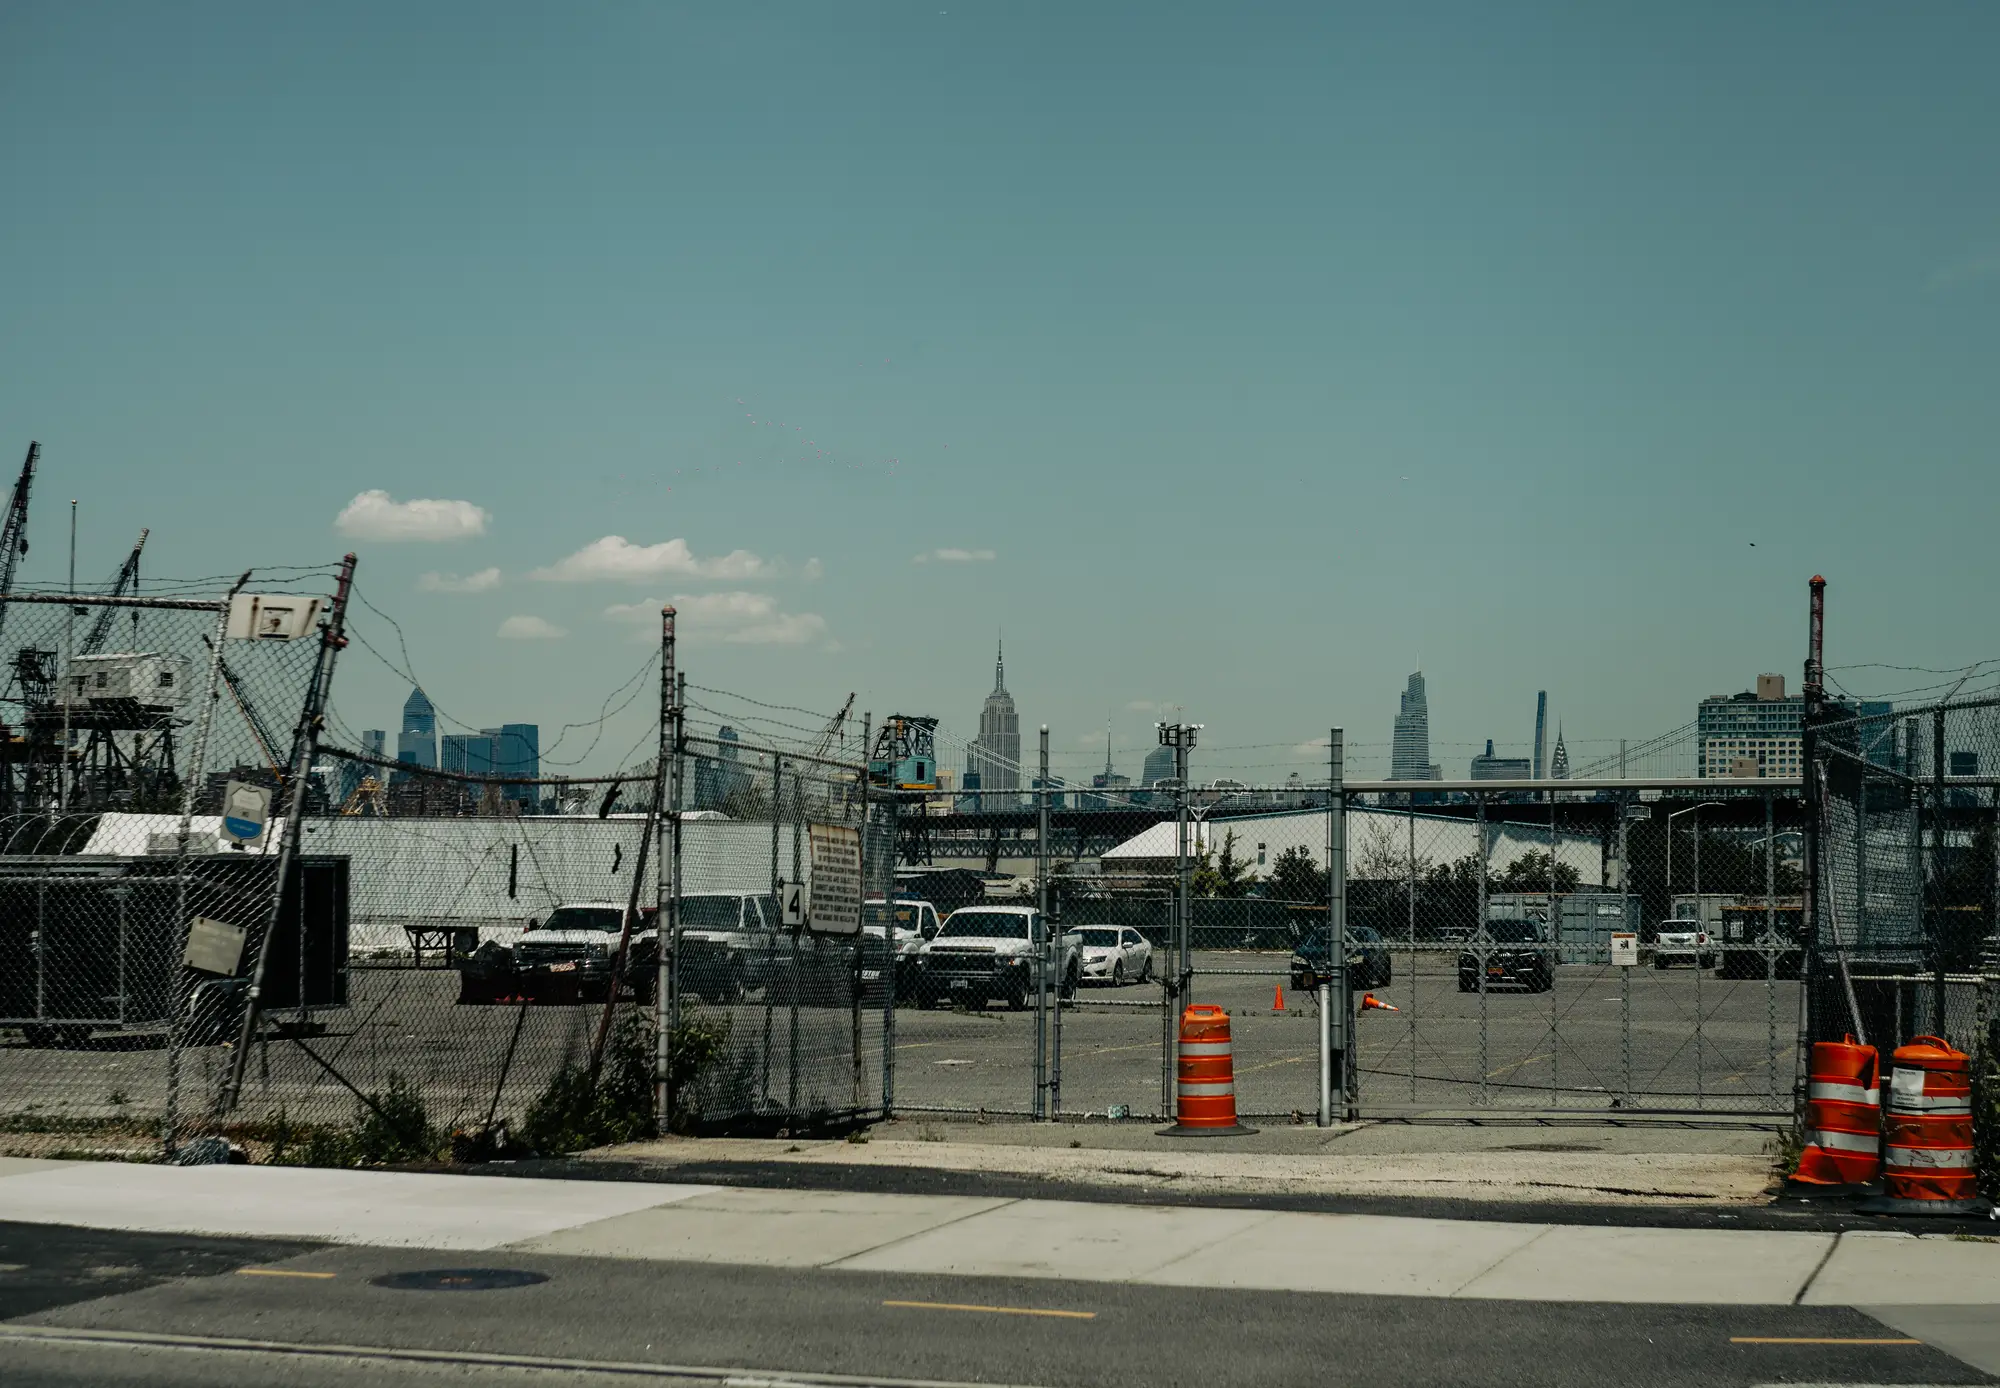
An assemblage only works if the underused parcels sit next to each other, share a rough use pattern, and nobody else has already quietly bought the pieces, and imagery can't tell you anything about that third condition. The first two, it can, if you know what to look for and you're willing to look at every parcel in the corridor instead of the five you already had a hunch about.
Most analysts find assemblage candidates by accident: a broker mentions a surface lot, you pull it up, you notice the strip mall next door looks half-empty too, and now you're manually walking the block in the county GIS viewer checking lot lines one at a time. A tip like that gets you one pairing, not a read on the forty blocks of candidates you haven't looked at yet.
What "underused" looks like from above
A single underused parcel is easy to spot: a surface parking lot with no structure, a one-story building sitting on a corridor zoned for four stories, a fenced yard with no improvement on it at all. The harder read is a cluster. You're looking for three or four parcels in a row where the improvement doesn't match the zoning or the surrounding build pattern, and where none of them show recent construction activity. A single vacant lot next to a brand-new mixed-use building isn't an assemblage opportunity. It's a lot somebody already passed on, or one that's spoken for.
The tell worth training your eye on is consistency of neglect. If parcel A has had the same low-rise structure on it for a decade, and parcels B and C next door show the same flat roofline and the same lack of any permit-driven change, that's a stronger signal than any one parcel alone. Shared loading areas, continuous surface parking across what should be separate lots, and matching setback patterns all point to parcels that have been functionally treated as one site for years, even if the deed records haven't caught up.
Reading change history instead of a single snapshot
A single image tells you what's there now. A change history tells you what hasn't happened, which for assemblage screening is the more useful question. A parcel with zero footprint change across several years of imagery, sitting inside a corridor where neighboring blocks have redeveloped, is exactly the kind of holdout that makes an assemblage both possible and, eventually, necessary to someone else's project too. If you can see that pattern across a run of adjacent parcels at once instead of one at a time, you've found the cluster before a competing developer has started knocking on doors.
Picking out a visual cluster of underused, unchanged parcels gets you a shortlist, but imagery stops being enough past that point. It doesn't tell you who owns each piece, whether they're under common control already, or whether a deal on parcel B is contingent on parcel A closing first. That part is still title research and owner outreach, done by a person, every time.
Where imagery screening fits
What imagery and change history can do is cut the submarket down from "every parcel" to "the parcels worth a closer look," which is most of the manual work in early-stage site assembly screening. Instead of scrolling a parcel map block by block looking for the right mix of low improvement value, static footprint, and zoning mismatch, you start from a list that's already flagged the clusters.
That's the gap Development Capacity is built around: a ranked parcel list for a submarket, built from high-resolution imagery and multi-year change history, that surfaces undeveloped and underused parcels, including the adjacent ones worth looking at as a group, so your pipeline starts from a shortlist instead of a blank map.
If you're staring down a submarket with no obvious starting point, that's worth a look before you open the GIS viewer again.